What are we talking about?
In this multi-part series, we’ll go through the benefits of being thoughtful around data design, what it may cost, how you can achieve it, and how we can help. Too often, smaller companies don’t invest in data warehousing because, in addition to bandwidth constraints, it can be perceived as complex, resource-intensive, and expensive. These concerns are understandable yet don’t necessarily reflect reality, and a little understanding of your options can go a long way. These posts are intended to provide some context and direction that hopefully will also result in some deeper follow up discussion.
We’ll tackle specific architectures and tools in future posts, but this first post will touch on some very simple examples of business questions and how your life can be made much easier. By exploring this topic, we can consider ways to free up your time to do your real job while also having easier access to deeper insights.
Common challenges
What are the biggest challenges many small companies face with data? Well, often the answer is “we don’t have it”, but that doesn’t fully describe the challenge. Typically, the issue boils down to one or more of the following:
- You track the data through some tool, but it is pre-aggregated in a way that doesn’t answer the question at hand
- Your data – sales reporting, marketing analytics, customer information, A/B results – is kept in silos, each a separate report that would be impossible or infeasible to combine
- You don’t have the proper skillsets or tools to do the necessary data manipulation (at least not without eating up half of your week)
- You’re not collecting it at all – while some “raw” data, such as customer transactions, will always exist somewhere in some form, other useful data such as site events is either captured as it occurs in the client or forever lost
Generally, these challenges can be avoided through a conceptually simple approach of:
- Be mindful of capturing data you care about and enact a plan to do it
- Store everything in its raw format in a (fancy term) lake – it’s cheap, and you’ll have it when you need it
- Maintain an ELT process to source raw data from the lake and manufacture the necessary tables in an analytical/columnar database
Use cases
Rather than try to give an exhaustive list of benefits, let’s jump to just a few quick miscellaneous business questions and how easy they would be with a proper data warehouse in place:
Attribution
What is weekly revenue and YoY change by first click channel group?
Without a data warehouse
Most likely, if you have no data warehousing in place, you’re probably also relying heavily on the Google Analytics console for channel attribution. GA can be a powerful tool, but as we know, it is generally a last click view by default. It’s worth mentioning that they are making advances in surfacing multi path funnel and attribution model comparisons in the console, but this data is not ideal to work with. Even when looking just at last click, you’ll need to download and manipulate the report as you need. Further, you’re constrained to working with the dimensions passed in your data layer and unable to join to other dimensions you may care about that exist in your production environment or e-commerce platform. Oh, and there’s that thing around sampling.
With a data warehouse
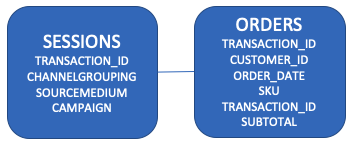
The pathway to doing this will be discussed in a future post, but suffice it to say that through some Google API calls, you can generate click-level records pathing to a transaction, and it’s worth noting that there are ways to also manufacture all visitor sessions without using GA 360. So, assume there is a table with a transaction ID and all associated visits leading to that transaction:
 You can write a query to do the attribution on the fly, the weekly aggregation, and the YoY calculation. You can pretty easily modify the logic to change attribution methodologies and even include other attribution sources such as “how did you hear about us” surveys into the logic.
SELECT
  YEAR(O.ORDER_DATE) AS YEAR,
  WEEK(O.ORDER_DATE) AS WEEK,
  S.CHANNEL_GROUPING,
  SUM(O.SUBTOTAL) AS REVENUE,
  SUM(O.SUBTOTAL)/LAG(SUM(O.SUBTOTAL)) OVER (PARTITION BY WEEK(O.ORDER_DATE) ORDER BY YEAR(O.ORDER_DATE)) - 1 AS YOY_PCT_CHANGE
FROM ORDERS O
  LEFT JOIN (-- FIND FIRST CLICK FOR EACH TRANSACTION
    SELECT A.TRANSACTION_ID, A.CHANNEL_GROUPING
    FROM (
      SELECT TRANSACTION_ID, ROW_NUMBER() OVER (PARTITION BY TRANSACTION_ID ORDER BY TIMESTAMP) AS CLICK_NUM
      FROM SESSIONS
    ) A
    WHERE A.CLICK_NUM = 1
  ) S ON O.TRANSACTION_ID = S.TRANSACTION_ID
GROUP BY 1,2,3
;
You’d probably have much of this already done in ETL and hence the query would be even simpler, you can easily maintain a table in the warehouse that maps customers or transactions to channels across different attribution methodologies, making the above query unncessary. You could imagine that you could then apply this attribution to many other analyses that you want to layer marketing channel into.
Segment economics
What is the 12 month LTV of customers who were vs weren’t mailed a catalog?
Without a data warehouse
You would probably need to spend some time digging up your catalog mailing records and combining them all into a single file; perhaps you’d also need to do a lookup of the addresses to find the appropriate customer IDs. You’d separately find a way to get how much each customer spent in their first 12 months and do a vlookup to combine it. It isn’t the most complicated exercise in the world, but you’d still probably eat up a couple hours of your time that you will never get back. And if you’re asking this question, there are probably several others that come up during a typical week.
With a data warehouse
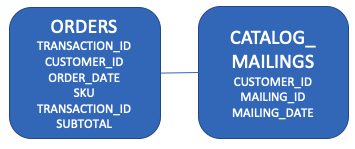
Within your schema, you’d have these tables which you can join together:

SELECT
  DATE_TRUNC('MONTH', C.FIRST_PURCHASE_DATE) AS ACQUISITION_COHORT,
  CASE WHEN M.CUSTOMER_ID IS NOT NULL THEN 'Y' ELSE 'N' END AS RECEIVED_CATALOG,
  SUM(CASE WHEN DATEDIFF('DAY', C.FIRST_PURCHASE_DATE, O.ORDER_DATE) < 365 THEN O.SUBTOTAL END) AS LTV_12_MONTHS
FROM ORDERS O
  INNER JOIN (
    SELECT O.CUSTOMER_ID, MIN(O.ORDER_DATE) AS FIRST_PURCHASE_DATE
    FROM ORDERS O
    GROUP BY 1
  ) C ON O.CUSTOMER_ID = C.CUSTOMER_ID -- attach first purchase date
  LEFT JOIN (
    SELECT DISTINCT CUSTOMER_ID FROM CATALOG_MAILINGS
  ) M ON O.CUSTOMER_ID = M.CUSTOMER_ID
GROUP BY 1,2
;
That was easy - since we have our catalog mailing records in a table in the same schema as our transactions, it took about a minute to write that query and probably a second for the result to return. No messy files getting emailed around, vlookups, or manual spreadsheet massaging. The analysis is overly simplistic, but you could easily layer in much more detail by joining to other tables.
In practice, the query would be even simpler that that above - if it doesn’t already exist in your customer table, the ETL process would have created a customer table with first purchase date so that we didn’t need to compute it.
Product category overlap
What common categories do customers purchase from?
Without a data warehouse
You should have this information in your e-commerce platform (transaction records with customers and products), but it is another example of time consuming manual data merging to download the data and properly parse it. If your transaction data already lives in a production database or read replica, you can technically do this, but you’ll be constrained by what is a transactional rather than analytical database - we’ll touch on that in a future post.
With a data warehouse
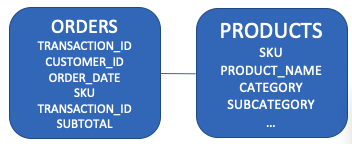
You can self-join your orders table, finding all other common transactions for a customer with the products arranged in columns. There are a lot of other analytical querying functions that can be used for product pathing and computing interesting distributions as well.

SELECT P.PRODUCT_CATEGORY, P2.PRODUCT_CATEGORY, COUNT(DISTINCT O2.CUSTOMER_ID)
FROM ORDERS O
  LEFT JOIN ORDERS O2 ON O.CUSTOMER_ID = O2.CUSTOMER_ID AND O.TRANSACTION_ID != O2.TRANSACTION_ID
  LEFT JOIN PRODUCTS P ON O.PRODUCT_ID = P.PRODUCT_ID
  LEFT JOIN PRODUCTS P2 ON O2.PRODUCT_ID = P2.PRODUCT_ID
You could group by as many other dimensions as you wish (season of purchase, customer type, etc) to get more granular segmentations; you could also compute time differences to get the distribution of time between these purchases.
This seems like a lot of SQL

The bad news: That’s true - data in its raw form does not turn itself into useful information, and don’t fool yourself otherwise. Someone needs to do that manipulation, either during ETL so that it exists that way in the database or in a BI layer.
The good news: Data engineering and SQL can and absolutely should be totally abstracted away from the end business user who only needs to interact with intermediate or final views of the data. A well designed arrangement is to ensure that an analyst or BI person with data engineering experience is responsible for creating reports, building highly dimensional dashboards that end users can pivot and filter through, and taking on ad hoc analysis. As far as resourcing, these are things that Digital Fuel can help with, and they will be the focuses of future posts.
Is saving a little bit of time really the only benefit?
At my previous company, we had an ETL process that stored all data in a columnar data warehouse that contained all visits, page views, marketing channel taxonomy, marketing spend, user purchases, product taxonomy, site events, A/B tests, CRM activities, surveys, marketing calendar, etc. The data was well formatted, allowing the analytics team to do all analysis without ever leaving a SQL editor or Tableau (occasionally Python or R for more specialized tasks). We could hence dig down any rabbit hole – we would often be the ones to find bugs, such as diagnosing that a certain customer type on a particular browser was unable to attach promo codes on a particular landing page.
Through highly dimensioned BI views that we built, drilling in on all business funnels and diagnostics was a quick exercise for anyone in marketing or product that otherwise could have taken days. We’d dissect revenue deviations among new customers by quickly decomposing it into the factors of spend, traffic, channel mix, page conversion, pricing, tests, and other latent factors. For repeat, we’d identify the suspect cohorts and understand if their composition was different or what other promotional activities were at play. Given the robust data warehouse, we could trace down any path using available data in the warehouse to arrive at a root cause. In the event a business user required a new view, no problem – just a matter of writing different SQL over the existing schema. Yes, it took discipline to build and maintain, but it did not break the bank, and we were able to understand our business at a far more granular level while actually spending fewer hours than we otherwise would have manually struggling to only 20% of that information.
The main point is that modern businesses have no excuse to not have full visibility into business funnels and be able to understand root causes and relative contributors to business performance. To have an effective BI tool that answers 80% of questions at the click of a mouse, you need a well designed data warehouse. And then to answer the remaining 20%, you again need that well defined warehouse to query and someone who is fluent in SQL.
Beyond analysis, useful marketing tactics such as user segmentation and related predictive modeling require non-aggregated relational data for both training and inference. While deploying live models may not be on your immediate horizon, being able to do some simple offline segmentation may be, and you’ll want the data.
Next
In our next post, we’ll put some more definition around what a data warehouse and ETL process looks like and how it can be implemented. Thanks for reading!